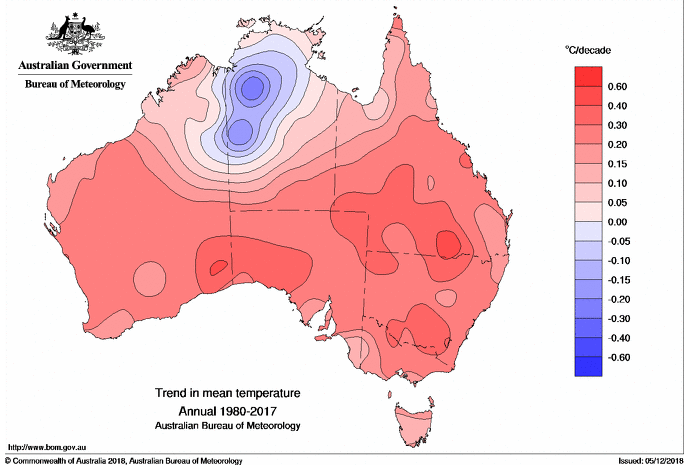
While there are few complaints about the super mild autumn temperatures, new temperature duration records are being set across large parts of south eastern Australia.
Professor Will Steffen has now written a report -
Climate Council Seasonal Update: Abnormal Autumn 2014 - in which he details that the 24 months to April 2014 were the hottest two year period on record, and due to the abnormally warm weather in May, the 24 months to May 2014 is likely to eclipse this record. With an El Nino brewing in the Pacific we are likely to have elevated temperatures through winter and spring which will influence soil moisture and other factors involved in increasing the number of extreme fire weather days with a longer fire season in southern regions later this year.
Weather Bureau releases special climate statement - 30 May 2014
The Bureau of Meteorology has released special climate statement 49 (PDF) summarising the autumn May warmspell. A persistent blocking high in the Tasman brought the warm period, but comes on top of a trend for hotter than usual periods:
The current warm event is the latest in a sequence of prolonged or intense warm spells that have affected a large part of the continent roughly every six weeks since the end of 2012. This coincides with record-breaking or well-above-average temperatures that have persisted across Australia for the past 22 months. The 12 months ending January 2014, February 2014, March 2014 and April 2014 have all been record-warm for Australia. It is virtually certain that the 12 months ending May 2014 will also set a new high record.
The year-to-date (January to May) temperature anomaly for Australia at 31 May 2014 is expected to be near +0.95 °C. This will mean that 2014 ranks in the top five warmest starts to a year on record behind 2005 (+1.17 °C), 1998 (+1.05 °C), 2013 (+1.04 °C) and 2007 (+0.96 °C).

The continental averaged daily maximum temperature was 27.35 °C or above on each of the five days from 21 to 25 May. The previous area record after this date was 27.23 °C on 23 May 1958. Daytime average temperatures were 4 to 6 degrees above average over over a large area encompassing most of South Australia, the western half of New South Wales, northwestern Victoria, southwestern Queensland and the southern Northern Territory.
Usually with warm spells of this type in Autumn night time temperatures remain average or are cooler than normal due to cloud free nights radiating the day's energy.
Minimum temperatures for this period (Figure 2) were also above average over most of the continent, except for parts of the New South Wales tablelands and the Kimberley region in the north of Western Australia. The largest anomalies, 4 to 6 °C above average, occurred in the South Australian outback and adjacent border areas of Western Australia and the Northern Territory.

Indeed, special mention is made for one night in Melbourne where the temperature climbed to 22C at 4.30am before falling:
A particularly unusual occurrence was the abnormal warmth in the Melbourne area in the early hours of the morning of 27 May, as northerly winds strengthened ahead of an approaching front. The Melbourne temperature rose to 22.1 °C around 4.30 am, which was only 0.3 °C short of the highest maximum temperature ever observed so late in the season. (It subsequently cooled below 18 °C after 6.30 am, preventing any records being set for high overnight minimum temperatures.)
With the blocking high in place bringing warmth to much of central and eastern Australia, the south west saw more cold fronts bringing rain resulting in southwestern Western Australia having its wettest May since 2005. "Pemberton experienced 23 consecutive days with rainfall from 7 to 29 May, a May record, and numerous other sites in the region had 20 to 22 days with rainfall during this period." said the BOM statement.
Some of the records broken
- Sydney - 19 consecutive days of 22 °C or above from 10 to 28 May (previous record of 9 days from 1 to 9 May 1978 and 1 to 9 May 2007).
- Sydney - 25 days for most consecutive days of 20 °C or above.
- Adelaide - 16 days for most consecutive days of 20 °C or above.
- Melbourne - 13 days for most consecutive days of 20 °C or above.
- Wilsons Promontory - 6 consecutive days of 20 °C or above. (No previous instance in May of a spell of more than 3 consecutive days of 20 °C or above, and only one 7 day spell in April in 1970)
- Victoria - 9 consecutive days from 14 to 22 May with a statewide mean maximum above 20 °C, matching the record set from 1 to 9 May 1972.
- Campania (Tas) - 24.1 °C observed on 15 May, highest maximum temperature so late in the season for any Tasmania site.
- Ouyen (Vic) - 27.4 °C on 26 May, highest maximum temperature so late in the season for Victoria.
- Birdsville (Qld) reached 34.7 °C highest maximum temperature of the event outside the tropics.
- Hobart - 23.9 on 15 May highest maximum temp on same or later day (previous 22.6 16/5/1947)
- Hobart - 14.9 on 19 May highest minimum on same or later day (previous 14.5 (24/5/2000,
31/5/1976)
- Canberra - 21.7 on 26 May highest maximum temp on same or later day (previous 20.1 (29/5/1954, 3 and 4/6/1957)
25 May 2014:
Sydney has just posted its longest Autumn warm spell for May going back to records which started in 1910. Saturday was the 14th day in May where the maximum temperature exceeded 22 degrees smashing the old record of 6 days. Average maximum temperatures will also beat the existing record for May - 22.7 degrees set in 1958 - according to Ben Domensino, a senior meteorologist at Weatherzone as
reported by the Sydney Morning Herald. Melbourne also has experienced abnormally mild temperatures with May 2014 exceeding May 1972 for the most days with temperatures over 20 degrees.
Canberra has also exceeded a 67-year-old record for a late-autumn heatwave last Thursday, when temperatures passed 17 degrees for the 11th consecutive day. Weatherzone meteorologist Max Gonzalez said the city had been experiencing above average day time temperatures and cooler than average nocturnal temperatures, "The average overnight temperature in Canberra this month has been 1.5 degrees which is 1.6 below the usual average," he said. "But during the day we’re averaging temperatures of 16.8 which is 1.2 degrees warmer than the monthly average." reported the Sydney Morning Herald.
The warmer than usual weather has also caused algae blooms in Lake Burley Griffin and Lake Tuggeranong forcing there closure for swimming. Adelaide's top of 27.4 degrees was that city's warmest on record this late in the season, while Hobart's 23.9 degrees on Thursday was that city's warmest so deep into autumn. Both cities' records go back more than a century, said Blair Trewin, a senior climatologist at the Bureau of Meteorology as reported by the Age.

See Scorcher.org.au for Australian heatwave distribution and data for recent and past heatwaves events for individual observation sites. Dr Sarah Perkins explains in detail on her blog about heatwaves, and finding the human signal in them.
The Snowy Mountains skifields are also decidedly still green even though the start of the ski season is fast approaching on the June Queens birthday weekend. Temperatures at most ski resorts are still above zero, still too warm to even start the snowmaking machines. Australia’s alpine zones have been identified as one of six key regions that are highly vulnerable to climate change. There has already been a substantial reduction in snow, and by the end of this century it is projected most snow will be gone. This will have a large affect on the shrinking size of the alpine ecosystems, not to mention ski resort tourism.
Increased temperatures during this Autumn heatwave may have implications for later in the year according to Climate scientist Dr Sarah perkins, as reported in the Sydney Morning Herald. Raised temperatures increase plant growth adding to fuel loads, but also help to dry out soils raising the prospect for more intense fires and droughts later in the year if dry conditions persist. Signs of an impending El Nino may also contribute to drought and a more intense and lengthy bushfire season in the later part of 2014. There are several signs the El Nino may match the strenth and intensity of the 1997/1998 El Nino.
NOAA: April tied with 2010 as hottest on record
This comes as NOAA announced that April 2014 tied with 2010 as the hottest April on record. According to NOAA:
The globally-averaged temperature across land and ocean surfaces tied with 2010 as the highest on record for the month, at 0.77°C (1.39°F) higher than the 20th century average. This also ties with April 2010 as the seventh highest departure from average among all months in the period of record, which dates back to January 1880. The record highest departure is 0.86°C (1.55°F) above average, set in February 1998, a month when El Niño conditions had been present for nearly a year. Neither El Niño nor La Niña have been present in the east central equatorial Pacific Ocean for the past two years; however, according to NOAA's Climate Prediction Center, the chance of El Niño emerging increases for the remainder of 2014, exceeding 65 percent during the Northern Hemisphere summer 2014.

The NOAA report also noted that average temperatures for Australia in April were high:
Australia observed its seventh highest average April temperature since records began in 1910, at 1.12°C (2.02°F) higher than the 1961–90 average. The average minimum temperature was fourth highest for April, at 1.32°C (2.38°F) above average, with Queensland setting a new record high monthly minimum for the state.