
The Is it hot right now? website provides a daily view on daily average temperatures for Australian capital cities, comparing the average temperature to it's history for that day, to see where it sits in the distribution of temperatures typical for the time of year.
The site was developed by climate researchers Mathew Lipson, Steefan Contractor and James Goldie. The data comes from the Bureau of Meteorology's ACORN-SAT.
Mat Lipson provided the Yearly average temperature charts and the 2018 heat maps for each city. The trend in rising temperatures is clearly visible in each. I have added details for each city of future projections done by CSIRO in 2015.
In the year heat maps for each city you can still see the fluctuations in temperature due to weather events, but the cold days (blue) are getting rarer, and the hot days (red) are getting more common, a telling sign of the long term climate temperature trend affecting all regions of Australia.
50 Degree days possible for Sydney and Melbourne
Dr Sophie Lewis, in a study published in Geophysical Research Letters in October 2017, assessed the potential magnitude of future extreme temperatures in Australia under Paris targets of an increase in global temperatures of 1.5 and 2 degrees Celsius above pre-industrial levels.
“Major Australian cities, such as Sydney and Melbourne, may experience unprecedented temperatures of 50 degrees Celsius under 2 degrees of global warming,” said Dr Lewis from the Fenner School of Environment and Society and the Centre of Excellence for Climate System Science at ANU.
“The increase in Australian summer temperatures indicates that other major cities should also be prepared for unprecedented future extreme heat.
“Our climate modelling has projected daily temperatures of up to 3.8 degrees Celsius above existing records in Victoria and New South Wales, despite the ambitious Paris efforts to curb warming.”
Dr Lewis said immediate climate action internationally could prevent record extreme seasons year after year.
“Urgent action on climate change is critical – the severity of possible future temperature extremes simulated by climate models in this study poses serious challenges for our preparedness for future climate change in Australia,” she said in a statement at ANU.
Sydney
Sydney City - Observatory Hill


Top 5
2016: 19.63°C
2017: 19.45°C
2013: 19.37°C
2014: 19.28°C
2018: 19.17°C
Future projections for hot days in Sydney (CSIRO 2015)
| THRESHOLD | CURRENT | 2030 RCP4.5 | 2090 RCP4.5 | 2090 RCP8.5 |
|---|---|---|---|---|
| Over 35 °C | 3.1 | 4.3 (4.0 to 5.0) | 6.0 (4.9 to 8.2) | 11 (8.2 to 15) |
| Over 40 °C | 0.3 | 0.5 (0.5 to 0.8) | 0.9 (0.8 to 1.3) | 2.0 (1.3 to 3.3) |
• Average temperatures will continue to increase in all seasons (very high confidence).
• More hot days and warm spells are projected with very high confidence. Fewer frosts are projected with high confidence.
• Decreases in winter rainfall are projected with medium confidence. Changes in other seasons are possible but unclear.
• Increased evapotranspiration is projected (high confidence).
• Increased intensity of extreme daily rainfall events is projected, with high confidence.
• Mean sea level will continue to rise and height of extreme sea-level events will also increase (very high confidence).
• A harsher fire-weather climate is projected (high confidence).
• On annual and decadal basis, natural variability in the climate system can act to either mask or enhance any long-term human induced trend, particularly in the next 20 years and for rainfall.
Sydney's West - Richmond RAAF


Top 5
2017: 18.61°C
2018: 18.57°C
2016: 18.55°C
2014: 18.22°C
2013: 18.13°C
Melbourne's West - Laverton RAAF


Top 5
2007: 15.85°C
2018: 15.72°C
2014: 15.68°C
2016: 15.49°C
2017: 15.45°C
Future projections for hot days in Melbourne (CSIRO 2015)
| THRESHOLD | CURRENT | 2030 RCP4.5 | 2090 RCP4.5 | 2090 RCP8.5 |
|---|---|---|---|---|
| Over 35 °C | 11 | 13 (12 to 15) | 16 (15 to 20) | 24 (19 to 32) |
| Over 40 °C | 1.6 | 2.4 (2.1 to 3.0) | 3.6 (2.8 to 4.9) | 6.8 (4.6 to 11) |
| Below 2 °C | 0.9 | 0.6 (0.8 to 0.4) | 0.2 (0.3 to 0.1) | 0.0 (0.0 to 0.0) |
• Average temperatures will continue to increase in all seasons (very high confidence).
• More hot days and warm spells are projected with very high confidence. Fewer frosts are projected with high confidence.
• Generally less rainfall in winter and spring is projected with high confidence. Changes to summer and autumn rainfall are possible but less clear.
• Increased evapotranspiration is projected (high confidence).
• Increased intensity of extreme daily rainfall events is projected, with high confidence.
• Mean sea level will continue to rise and height of extreme sea-level events will also increase (very high confidence).
• A harsher fire-weather climate is projected (high confidence).
• On annual and decadal basis, natural variability in the climate system can act to either mask or enhance any long-term human induced trend, particularly in the next 20 years and for rainfall.
Canberra Airport


Top 5
2007: 14.64°C
2018: 14.52°C
2009: 14.52°C
2016: 14.39°C
2006: 14.36°C
Future projections for hot days in Canberra (CSIRO 2015)
| THRESHOLD | CURRENT | 2030 RCP4.5 | 2090 RCP4.5 | 2090 RCP8.5 |
|---|---|---|---|---|
| Over 35 °C | 7.1 | 12 (9.4 to 14) | 17 (13 to 23) | 29 (22 to 39) |
| Over 40 °C | 0.3 | 0.6 (0.4 to 0.8) | 1.4 (0.8 to 2.8) | 4.8 (2.3 to 7.5) |
| Below 2 °C | 91 | 81 (87 to 76) | 68 (75 to 61) | 43 (52 to 35) |
• Average temperatures will continue to increase in all seasons (very high confidence).
• More hot days and warm spells are projected with very high confidence. Fewer frosts are projected with high confidence.
• By late in the century (2090), less rainfall is projected during the winter and spring with high confidence.
• There is medium confidence that summer and autumn rainfall will remain unchanged.
• Increased evapotranspiration is projected (high confidence).
• Extreme daily rainfall intensity is projected to increase, with high confidence.
• A harsher fire-weather climate in the future (high confidence).
• On annual and decadal basis, natural variability in the climate system can act to either mask or enhance any long-term human induced trend, particularly in the next 20 years and for rainfall.
Brisbane Airport


Top 5
2017: 21.23°C
1973: 21.23°C
2016: 21.18°C
1998: 20.96°C
2014: 20.96°C
Future projections for hot days in Brisbane (CSIRO 2015)
| THRESHOLD | CURRENT | 2030 RCP4.5 | 2090 RCP4.5 | 2090 RCP8.5 |
|---|---|---|---|---|
| Over 35 °C | 12 | 18 (15 to 22) | 27 (21 to 42) | 55 (37 to 80) |
| Over 40 °C | 0.8 | 1.2 (1.1 to 1.6) | 2.1 (1.5 to 3.9) | 6.0 (2.9 to 11) |
• Average temperatures will continue to increase in all seasons (very high confidence).
• More hot days and warm spells are projected (very high confidence). Fewer frosts are projected (high confidence).
• Annual/seasonal-average rainfall changes are possible but unclear.
• Increased evapotranspiration is projected (high confidence).
• Increased intensity of extreme daily rainfall events is projected, with high confidence.
• Mean sea level will continue to rise and height of extreme sea-level events will also increase (very high confidence).
• A harsher fire-weather climate is projected (high confidence).
• On annual and decadal basis, natural variability in the climate system can act to either mask or enhance any long-term human induced trend, particularly in the next 20 years and for rainfall.
Adelaide (Kent Town)


Top 5
2018: 18.32°C
2013: 18.31°C
2007: 18.30°C
2009: 18.29°C
2014: 18.18°C
Future projections for hot days in Adelaide (CSIRO 2015)
| THRESHOLD | CURRENT | 2030 RCP4.5 | 2090 RCP4.5 | 2090 RCP8.5 |
|---|---|---|---|---|
| Over 35 °C | 20 | 26 (24 to 29) | 32 (29 to 38) | 47 (38 to 57) |
| Over 40 °C | 3.7 | 5.9 (4.7 to 7.2) | 9.0 (6.8 to 12) | 16 (12 to 22) |
| Below 2 °C | 1.1 | 0.5 (0.8 to 0.4) | 0.2 (0.4 to 0.1) | 0.0 (0.0 to 0.0) |
• Average temperatures will continue to increase in all seasons (very high confidence).
• More hot days and warm spells are projected (very high confidence) with fewer frosts (high confidence).
• A continuation of the trend of decreasing winter rainfall is projected (high confidence). Spring rainfall decrease is also expected (high confidence). Changes in other seasons are unclear.
• Increased evapotranspiration is projected (high confidence).
• Increased intensity of extreme daily rainfall events is projected (high confidence).
• Mean sea level will continue to rise and the height of extreme sea-level events will also increase (very high confidence).
• A harsher fire-weather climate is projected (with high confidence).
• On annual and decadal basis, natural variability in the climate system can act to either mask or enhance any long-term human induced trend, particularly in the next 20 years and for rainfall.
Perth Airport


Top 5
2011: 19.80°C
2015: 19.44°C
2013: 19.34°C
1999: 19.25°C
2014: 19.21°C
Future projections for hot days in Perth (CSIRO 2015)
| THRESHOLD | CURRENT | 2030 RCP4.5 | 2090 RCP4.5 | 2090 RCP8.5 |
|---|---|---|---|---|
| Over 35 °C | 28 | 36 (33 to 39) | 43 (37 to 52) | 63 (50 to 72) |
| Over 40 °C | 4 | 6.7 (5.4 to 7.5) | 9.7 (6.9 to 13) | 20 (12 to 25) |
| Below 2 °C | 3.4 | 2.1 (2.5 to 1.4) | 0.9 (1.3 to 0.7) | 0.1 (0.4 to 0.0) |
• Average temperatures will continue to increase in all seasons (very high confidence).
• More hot days and warm spells are projected with very high confidence. Fewer frosts are projected with high confidence.
• A continuation of the trend of decreasing winter rainfall is projected with high confidence. Spring rainfall decreases are also projected with high confidence. Changes in other seasons are unclear
• Increased evapotranspiration is projected (high confidence).
• Increased intensity of extreme daily rainfall events is projected, with medium confidence.
• Mean sea level will continue to rise and height of extreme sea-level events will also increase (very high confidence).
• A harsher fire-weather climate in the future (high confidence).
• On annual and decadal basis, natural variability in the climate system can act to either mask or enhance any long-term human induced trend, particularly in the next 20 years and for rainfall.
Hobart


Top 5
1988: 14.01°C
2016: 13.99°C
2018: 13.88°C
2017: 13.87°C
2000: 13.86°C
Future projections for hot days in Hobart (CSIRO 2015)
| THRESHOLD | CURRENT | 2030 RCP4.5 | 2090 RCP4.5 | 2090 RCP8.5 |
|---|---|---|---|---|
| Over 35 °C | 1.6 | 2.0 (1.9 to 2.1) | 2.6 (2.0 to 3.1) | 4.2 (3.2 to 6.3) |
| Below 2 °C | 9.1 | 5.8 (6.9 to 3.7) | 2.1 (4.1 to 1.1) | 0.3 (0.6 to 0.1) |
• Average temperatures will continue to increase in all seasons (very high confidence).
• More hot days and warm spells are projected with very high confidence. Fewer frosts are projected with high confidence.
• More rainfall in winter is projected with medium confidence, with a decrease in spring. Changes to summer and autumn rainfall are possible but less clear.
• Increased evapotranspiration is projected (high confidence).
• Increased intensity of extreme daily rainfall events is projected, with high confidence.
• Mean sea level will continue to rise and height of extreme sea-level events will also increase (very high confidence). • A harsher fire-weather climate in the future (high confidence).
• On annual and decadal basis, natural variability in the climate system can act to either mask or enhance any long-term human induced trend, particularly in the next 20 years and for rainfall.
Darwin


Top 5
2016: 28.71°C
1998: 28.46°C
2018: 28.29°C
2010: 28.25°C
1973: 28.22°C
Future projections for hot days in Darwin (CSIRO 2015)
| THRESHOLD | CURRENT | 2030 RCP4.5 | 2090 RCP4.5 | 2090 RCP8.5 |
|---|---|---|---|---|
| Over 35 °C | 11 | 43 (25 to 74) | 111 (54 to 211) | 265 (180 to 322) |
| Over 40 °C | 0 | 0.0 (0.0 to 0.0) | 0.0 (0.0 to 0.2) | 1.3 (0.2 to 11) |
• Average temperatures will continue to increase in all seasons (very high confidence).
• More hot days and warm spells are projected with very high confidence.
• Changes to annual/seasonal-average rainfall are possible but unclear.
• Increased intensity of extreme daily rainfall events is projected, with high confidence.
• Increased evapotranspiration is projected (high confidence).
• Mean sea level will continue to rise and height of extreme sea-level events will also increase (very high confidence).
• Fewer but more-intense tropical cyclones by the end of the century (medium confidence), but with notable decadal variability.
• On annual and decadal basis, natural variability in the climate system can act to either mask or enhance any long-term human induced trend, particularly in the next 20 years and for rainfall.
Alice Springs


Top 5
2013: 22.40°C
1996: 22.30°C
1998: 22.22°C
2005: 22.18°C
2004: 22.16°C
Future projections for hot days in Alice Springs (CSIRO 2015)
| THRESHOLD | CURRENT | 2030 RCP4.5 | 2090 RCP4.5 | 2090 RCP8.5 |
|---|---|---|---|---|
| Over 35 °C | 94 | 113 (104 to 122) | 133 (115 to 152) | 168 (145 to 193) |
| Over 40 °C | 17 | 31 (24 to 40) | 49 (33 to 70) | 83 (58 to 114) |
| Below 2 °C | 33 | 24 (28 to 19) | 13 (20 to 8.4) | 2.1 (6.0 to 0.8) |
• Average temperatures will continue to increase in all seasons (very high confidence).
• More hot days and warm spells are projected (with very high confidence). Fewer frosts are projected with high confidence.
• Changes to annual/seasonal-average rainfall are possible but unclear.
• Increased intensity of extreme daily rainfall events is projected (with high confidence).
• On annual and decadal basis, natural variability in the climate system can act to either mask or enhance any long-term human induced trend, particularly in the next 20 years and for rainfall.
• Increased evapotranspiration is projected (high confidence)
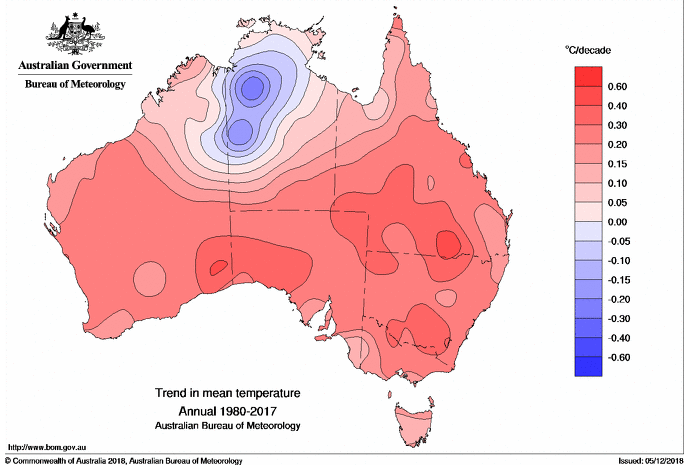
The annual mean temperature trend for Australia

A linear trend of 0.13 °C per decade from 1910-2018
Sources:
- Yearly average graphs and top 5 were reused from the Urbanist website: How hot was 2018 in 10 Australian cities by Mathew Lipson, used with the author's permission. Mathew also provided the 2018 annual heatmaps for this post.
- Future projections: Table B: Current Average (1981–2010) Annual Number Of Days Above 35 And 40 °C And Below 2 °C (FROST Risk). Estimates For 30-Year Periods Centred On 2030 (RCP4.5) And 2090 (RCP4.5 And Rcp8.5) Are Derived By Applying The Median, 10th And 90th Percentile Projections To Observed Daily Temperature Data For 1981-2010 (ACORN-SAT). From Climate Change in Australia - Projections for selected Australian Cities.
Copyright CSIRO 2015 (PDF) - For the trend in heatwaves, see the Climate Council 2014 report: Heatwaves: Hotter, Longer, More Often
- Lewis, S. C., King, A. D., & Mitchell, D. M. (2017). Australia’s unprecedented future temperature extremes under Paris limits to warming. Geophysical Research Letters, 44, 9947–9956. https://doi.org/10.1002/2017GL074612 (abstract)
No comments:
Post a Comment