Wednesday, January 9, 2019
Mapping the heat trend in Australia's capital cities for 2018 and future projections
The Is it hot right now? website provides a daily view on daily average temperatures for Australian capital cities, comparing the average temperature to it's history for that day, to see where it sits in the distribution of temperatures typical for the time of year.
The site was developed by climate researchers Mathew Lipson, Steefan Contractor and James Goldie. The data comes from the Bureau of Meteorology's ACORN-SAT.
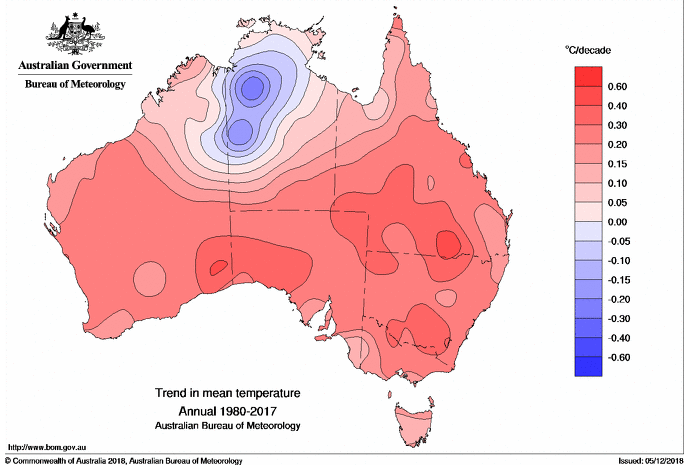
Mat Lipson provided the Yearly average temperature charts and the 2018 heat maps for each city. The trend in rising temperatures is clearly visible in each. I have added details for each city of future projections done by CSIRO in 2015.
In the year heat maps for each city you can still see the fluctuations in temperature due to weather events, but the cold days (blue) are getting rarer, and the hot days (red) are getting more common, a telling sign of the long term climate temperature trend affecting all regions of Australia.
Monday, December 7, 2015
Paris City Summit of Mayors commits to 100 per cent #renewables by 2050

Paris Mayor Anne Hidalgo at Cities Climate Summit Photo: ©Mairie de Paris
A meeting of nearly a 1,000 city mayors from around the world meeting in Paris signed a declaration on Friday that supports a municipal transition to 100 percent Renewable Energy. Read the declaration (PDF)
Paris Mayor Anne Hidalgo said according to a report on Citiscope, "As I told the negotiators when bringing them our contribution, cities are not waiting for them to give us the solution," she said. "We are moving ahead and making a solution possible."
Tuesday, October 15, 2013
Climate Departure: Oceans already outside historical variability as cities and ecosystems follow
Researchers from the University of Hawaii have estimated the year when we depart the climate variability we have historically known for cities around the globe. But the study also identifies that the planet's oceans have already passed their climate departure point, and that the greatest impact of global warming will be felt in biodiversity and ecosystems in the tropics.
In a study published in Nature - The projected timing of climate departure from recent variability (abstract) - researchers lead by Camilo Mora from the Geography Department at the University of Hawaii sought to identify the point at which the climate at 54,000 locations on Earth will exceed the bounds of historical variability. They used a baseline period of 1860 to 2005 to determine natural temperature variability. Using results averaged from 39 different climate models, they then determined for each location measured the year point in which the coldest years are likely to be consistently hotter than any of the past 150 years.
Friday, May 31, 2013
Cities to get much hotter as heatwaves amplify Urban Heat Island Effect

A new study just published looked at the way Urban Heat Island effect interacts with heatwaves. It is not a simple addition of the heatwave increase in temperature added to the urban heat island temperature: heatwaves exacerbate and amplify the Urban Heat Island Effect so that the impact is magnified. This is a major energy use and health concern for people living in cities, particularly the poor and vulnerable.
"Not only do heat waves increase the ambient temperatures, but they also intensify the difference between urban and rural temperatures. As a result, the added heat stress in cities will be even higher than the sum of the background urban heat island effect and the heat wave effect." say the researchers, Dan Li and Elie Bou-Zeid, both from the Department of Civil and Environmental Engineering, Princeton University

